Compiled by SK Kutubuddin, Founder & Senior Care Researcher · Figures checked against the original sources on 30 October 2026
Key numbers at a glance
1 in 4+
adults 65 and older fall each year[1]
4.5 million
emergency room visits a year for falls in older adults[1]
41,400
adults 65+ died from an unintentional fall in 2023[2]
319,000
older adults hospitalized for a hip fracture each year[1]
Under half
of older adults who fall tell their doctor[1]
~$50 billion
in medical costs from older adult falls (2015)[3]
How often older adults fall
- More than 1 in 4 adults aged 65 and older fall each year.[1]
- Less than half of them tell their doctor, so many falls never reach a medical record.[1]
- Falling once doubles the chance of falling again.[1]
- About 1 in 10 falls causes an injury that limits normal activity for a day or more or leads to medical care. Counted per person rather than per fall, about 37% of older adults who fall report an injury like this.[1]
Injuries and hospital care
Falls by older adults lead to about 4.5 million emergency room visits a year. About 3.1 million of those patients are treated and sent home; about 1.4 million are admitted to hospital.[1]
Fall deaths by age and sex
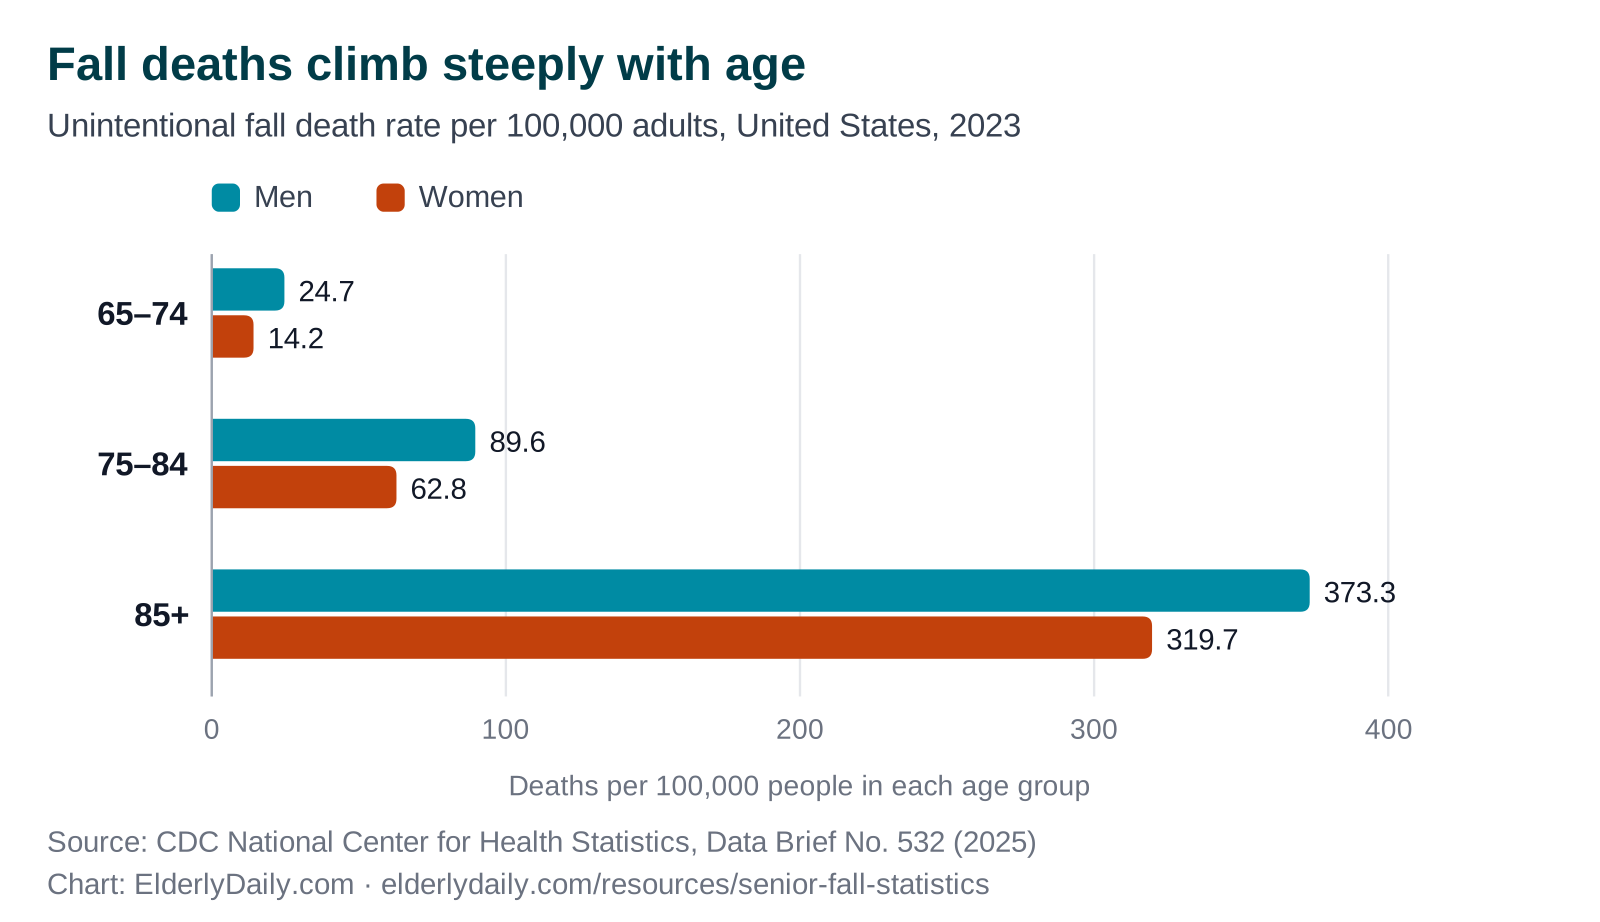
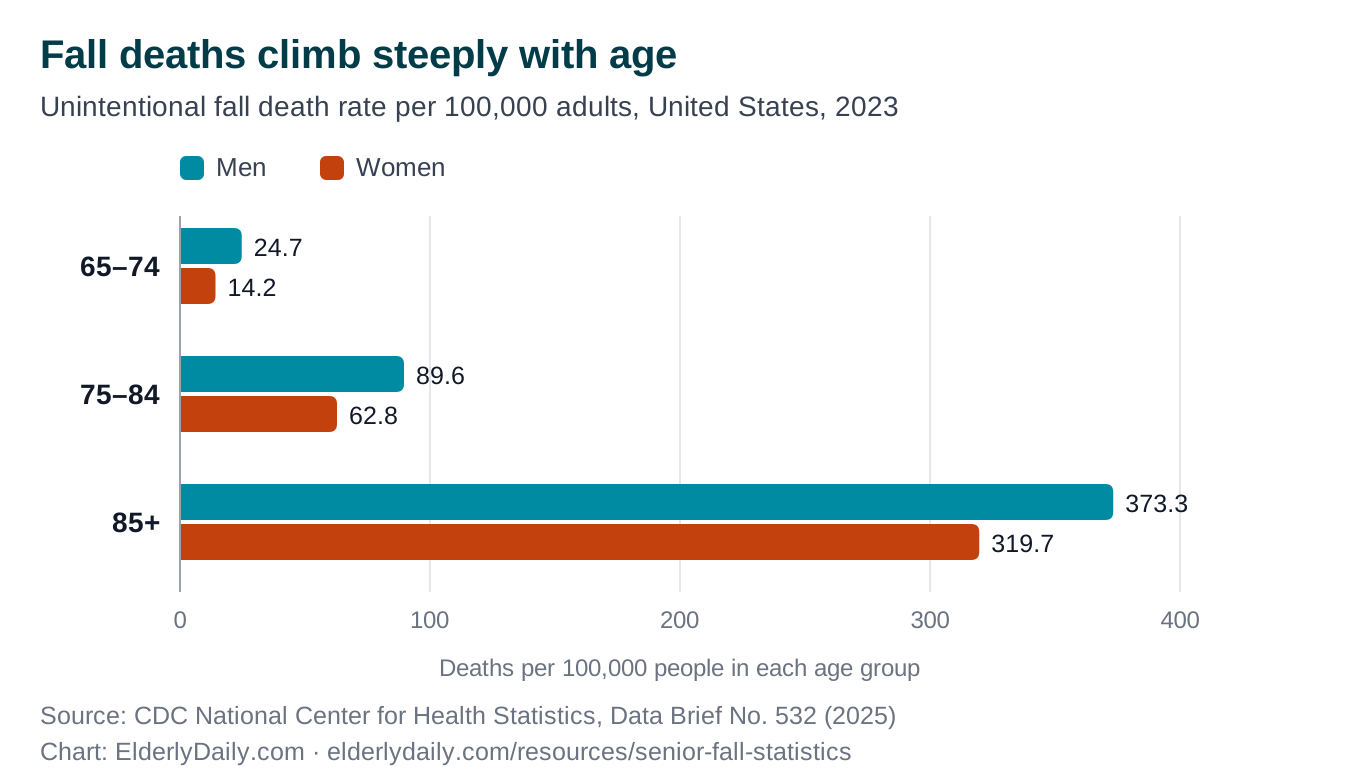
In 2023, 41,400 adults aged 65 and older died from an unintentional fall — 69.9 deaths for every 100,000 people in that age group. The risk climbs steeply with age, and men had higher rates than women in every age group.[2]
Free to republish with credit to ElderlyDaily: download PNG · SVG
How the rates changed from 2003 to 2023
Death rates from falls rose in every age group over those 20 years. The sharpest rise was among women aged 85 and older.[2]
| Age group | Sex | 2003 (per 100,000) | 2023 (per 100,000) | Change |
|---|---|---|---|---|
| 65–74 | Men | 14.3 | 24.7 | +73% |
| 65–74 | Women | 8.3 | 14.2 | +71% |
| 75–84 | Men | 51.3 | 89.6 | +75% |
| 75–84 | Women | 33.6 | 62.8 | +87% |
| 85+ | Men | 178.3 | 373.3 | +109% |
| 85+ | Women | 128.5 | 319.7 | +149% |
Rates from CDC NCHS Data Brief 532; the change column is our own calculation from those rates.
Fall death rates by state
Where an older person lives makes a large difference. In 2023 the highest state rate was more than five times the lowest.[2]
| State | Deaths per 100,000 (65+) |
|---|---|
| Wisconsin | 158.4 |
| Minnesota | 132.6 |
| Maine | 126.5 |
| Oklahoma | 122.2 |
| Vermont | 120.9 |
| State | Deaths per 100,000 (65+) |
|---|---|
| Alabama | 29.5 |
| New Jersey | 34.6 |
| California | 40.0 |
| Louisiana | 45.6 |
| Georgia | 45.9 |
What falls cost
The most-cited estimate puts medical spending on falls in adults 65+ at about $50 billion in 2015. Roughly three-quarters of it was paid by Medicare and Medicaid.[3]
| Who paid (non-fatal falls) | 2015 cost |
|---|---|
| Medicare | about $29 billion |
| Private insurance and out-of-pocket | about $12 billion |
| Medicaid | about $8.7 billion |
| Fatal falls (all payers) | about $754 million |
Figures are in 2015 dollars and have not been adjusted for inflation.
What these numbers mean for your family
Two facts above matter most at home: falls often go unreported, and one fall raises the chance of another. If your parent has fallen — even without injury — that is worth raising with their doctor.
About these numbers
ElderlyDaily did not collect this data. We compiled it from the publishers listed below and link every figure to its source. Different sources cover different years, so we give the year wherever the source does. We check the figures against the original pages and update this page when the CDC publishes newer data.
How to cite this page
ElderlyDaily. “Senior Fall Statistics 2026: Key Numbers on Falls in Adults 65+.” Updated 30 October 2026. https://elderlydaily.com/resources/senior-fall-statistics
Journalists and researchers: see our press page for data requests.
Download this data (CSV), with a source link on every row.
Sources
- [1] CDC — Older Adult Falls Data: Facts and Stats (page updated 4 September 2026)
- [2] CDC National Center for Health Statistics — Data Brief No. 532, Unintentional Fall Deaths in Adults Age 65 and Older: United States, 2023 (June 2025)
- [3] Florence CS, Bergen G, Atherly A, Burns E. Medical Costs of Fatal and Nonfatal Falls in Older Adults. Journal of the American Geriatrics Society, 2018; 66(4): 693–698
This page is general information, not medical advice. Talk to a doctor about any fall or fall risk.